---
title: "Time"
date: "`r Sys.Date()`"
output: rmarkdown::html_vignette
vignette: >
%\VignetteIndexEntry{Time}
%\VignetteEngine{knitr::rmarkdown}
\usepackage[utf8]{inputenc}
---
```{r include = FALSE}
knitr::opts_chunk$set(
collapse = TRUE,
comment = "#>",
fig.path = "man/figures/README-",
out.width = "100%",
echo = TRUE,
warning = FALSE,
eval = T
)
```
```{r, echo = FALSE, eval = TRUE, include = FALSE, messages = FALSE}
library(bdc)
```
#### **Introduction**
This module of the *bdc* package extracts the collection year whenever possible from complete and legitimate date information and flags dubious (e.g., 07/07/10), illegitimate (e.g., 1300, 2100), or not supplied (e.g., 0 or NA) collecting year.
#### **Installation**
Check [**here**](https://brunobrr.github.io/bdc/#installation) how to install the bdc package.
#### **Reading the database**
Read the database created in the [**Space**](https://brunobrr.github.io/bdc/articles/space.html) module of the *bdc* package. It is also possible to read any datasets containing the \*\*required\*\* fields to run the function (more details [here](https://brunobrr.github.io/bdc/articles/integrate_datasets.html)).
```{r echo=TRUE, eval=FALSE}
database <-
readr::read_csv(here::here("Output/Intermediate/03_space_database.csv"))
```
```{r echo=FALSE, eval=TRUE}
database <-
readr::read_csv(system.file("extdata/outpus_vignettes/03_space_database.csv", package = "bdc"), show_col_types = FALSE)
```
```{r echo=F, message=FALSE, warning=FALSE, eval=TRUE}
DT::datatable(
database[1:15,], class = 'stripe', extensions = 'FixedColumns',
rownames = FALSE,
options = list(
pageLength = 3,
dom = 'Bfrtip',
scrollX = TRUE,
fixedColumns = list(leftColumns = 2)
)
)
```
⚠️**IMPORTANT:**
The results of the VALIDATION test used to flag data quality are appended in separate fields in this database and retrieved as TRUE (✅ ok) or FALSE (❌check carefully).
#### **1 - Records lacking event date information**
*VALIDATION*. This function flags records lacking event date information (e.g., empty or NA).
```{r}
check_time <-
bdc_eventDate_empty(data = database, eventDate = "verbatimEventDate")
```
#### **2 - Extract year from event date**
*ENRICHMENT*. This function extracts four-digit years from unambiguously interpretable collecting dates.
```{r}
check_time <-
bdc_year_from_eventDate(data = check_time, eventDate = "verbatimEventDate")
```
#### **3 - Records with out-of-range collecting year**
*VALIDATION*. This function identifies records with illegitimate or potentially imprecise collecting years. The year provided can be out-of-range (e.g., in the future) or collected before a specified year supplied by the user (e.g., 1900). Older records are more likely to be imprecise due to the locality-derived geo-referencing process.
```{r}
check_time <-
bdc_year_outOfRange(data = check_time,
eventDate = "year",
year_threshold = 1900)
```
#### **Report**
Here we create a column named **.summary** summing up the results of all **VALIDATION** tests. This column is **FALSE** when a record is flagged as FALSE in any data quality test (❌check carefully. potentially invalid or suspect record).
```{r}
check_time <- bdc_summary_col(data = check_time)
```
Creating a report summarizing the results of all tests of the *bdc* package. The report can be automatically saved if `save_report = TRUE.`
```{r eval=FALSE}
report <-
bdc_create_report(data = check_time,
database_id = "database_id",
workflow_step = "time",
save_report = FALSE)
report
```
```{r echo=FALSE, eval=TRUE}
report <-
readr::read_csv(
system.file("extdata/outpus_vignettes/04_Report_time.csv",
package = "bdc"),
show_col_types = FALSE
)
```
```{r echo=FALSE, message=FALSE, warning=FALSE, eval=TRUE}
DT::datatable(
report, class = 'stripe', extensions = 'FixedColumns',
rownames = FALSE,
options = list(
# pageLength = 5,
dom = 'Bfrtip',
scrollX = TRUE,
fixedColumns = list(leftColumns = 2)
)
)
```
#### **Figures**
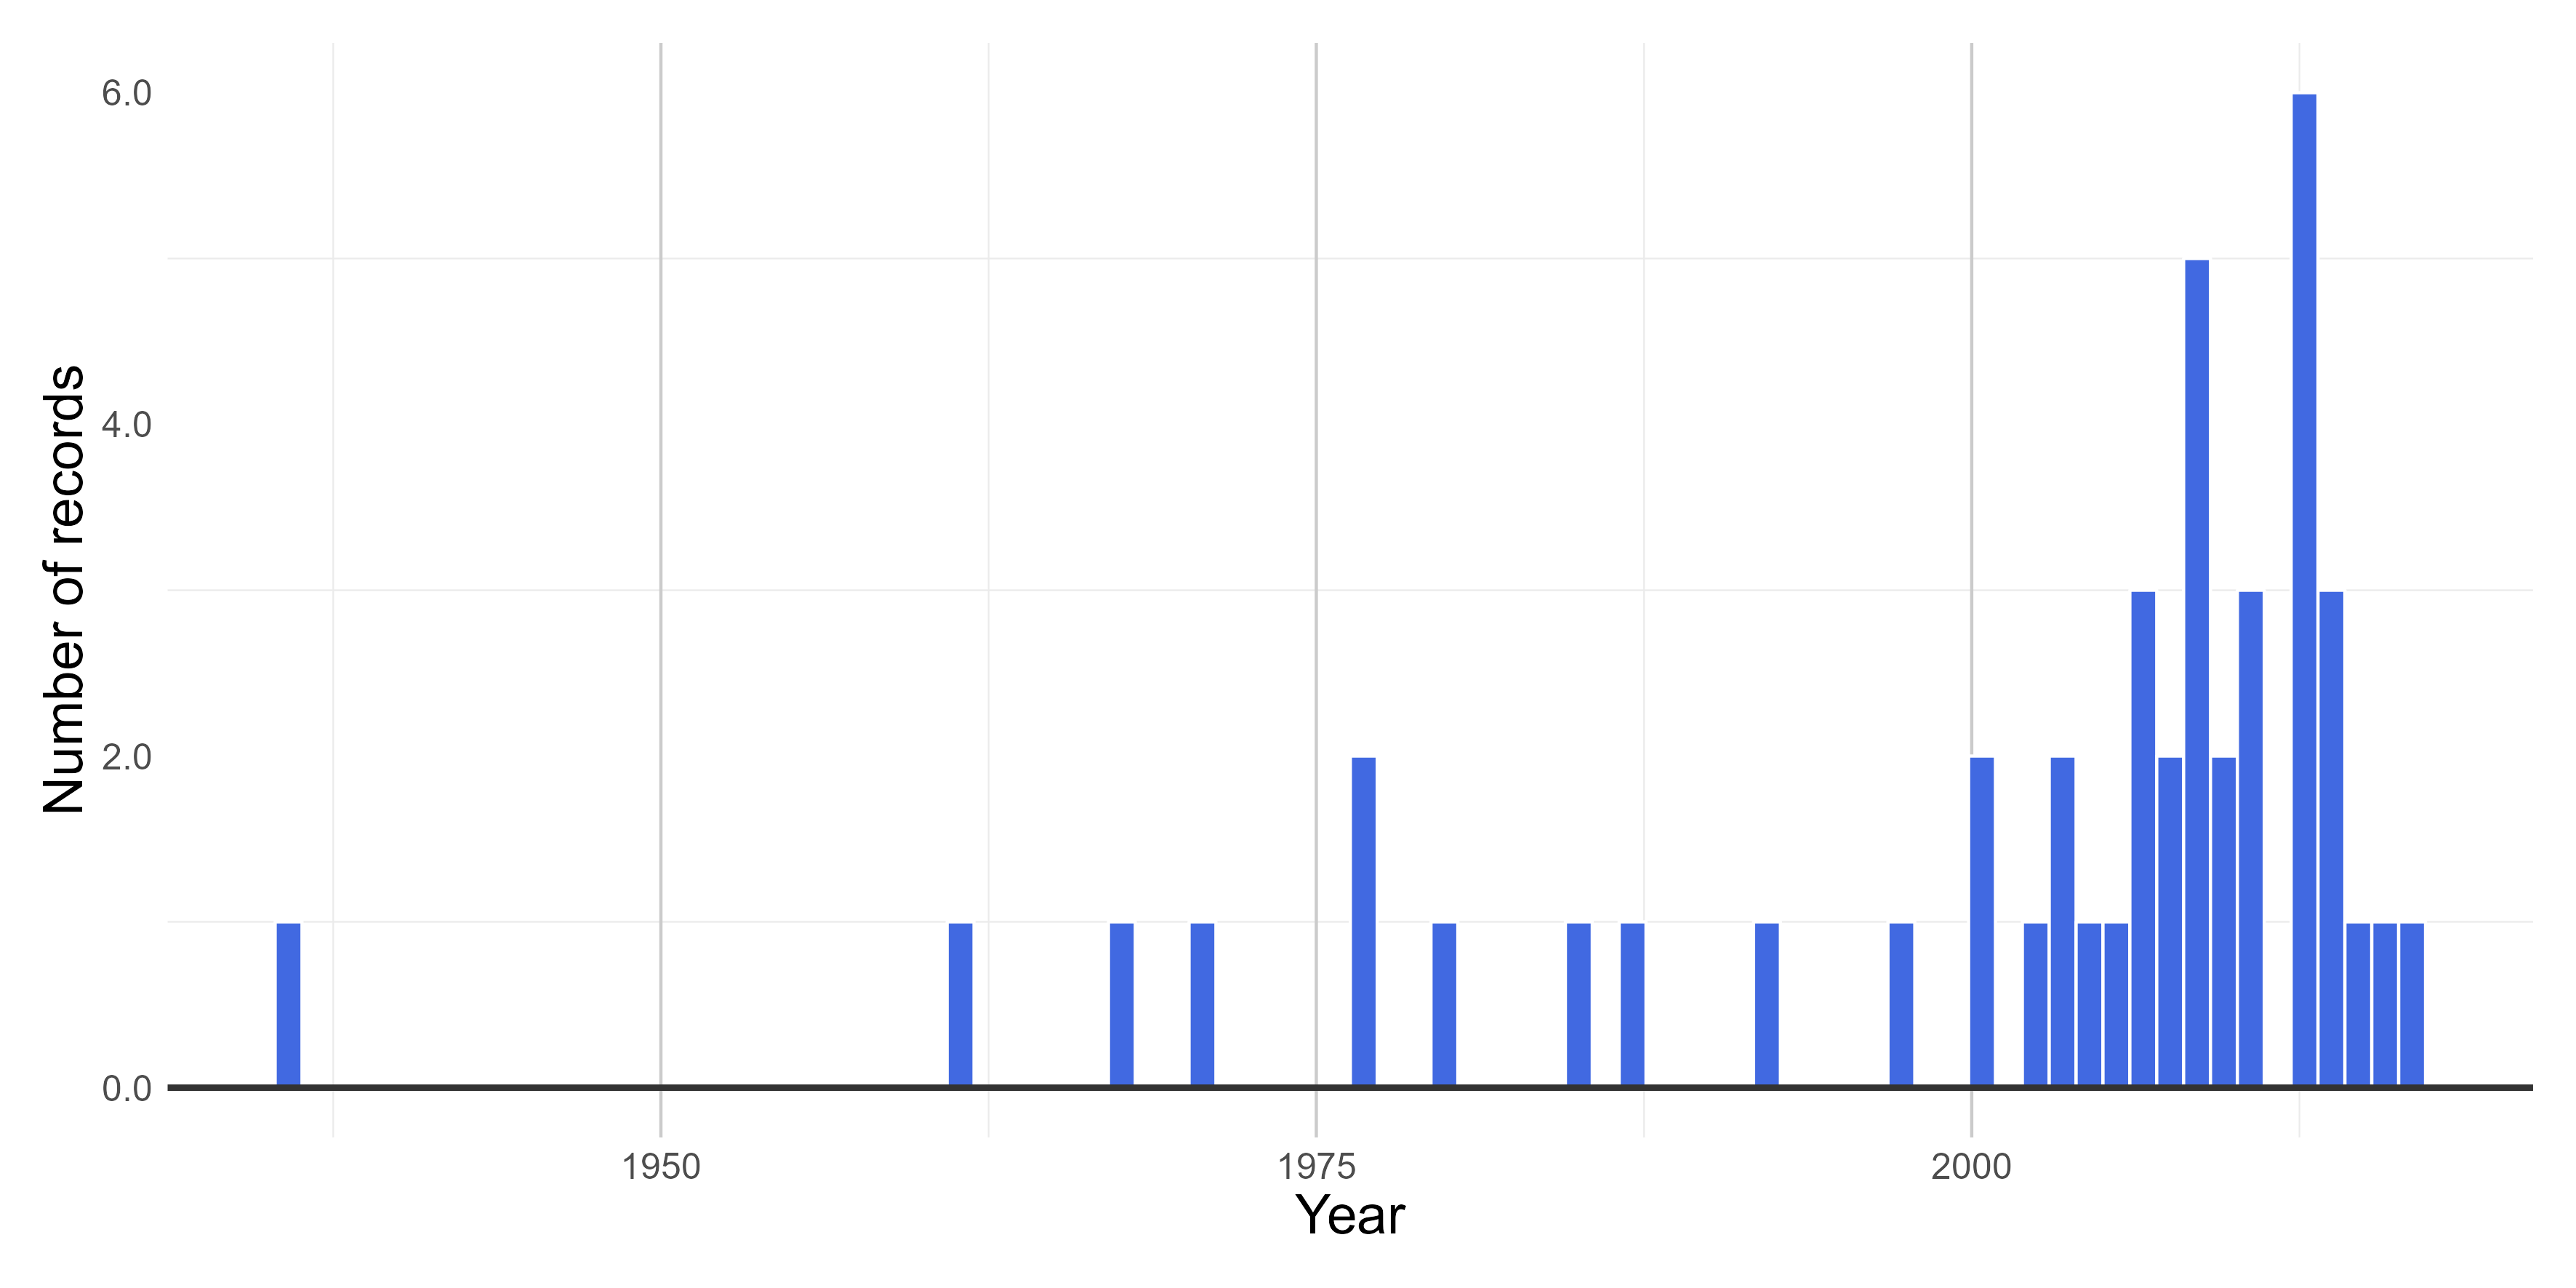
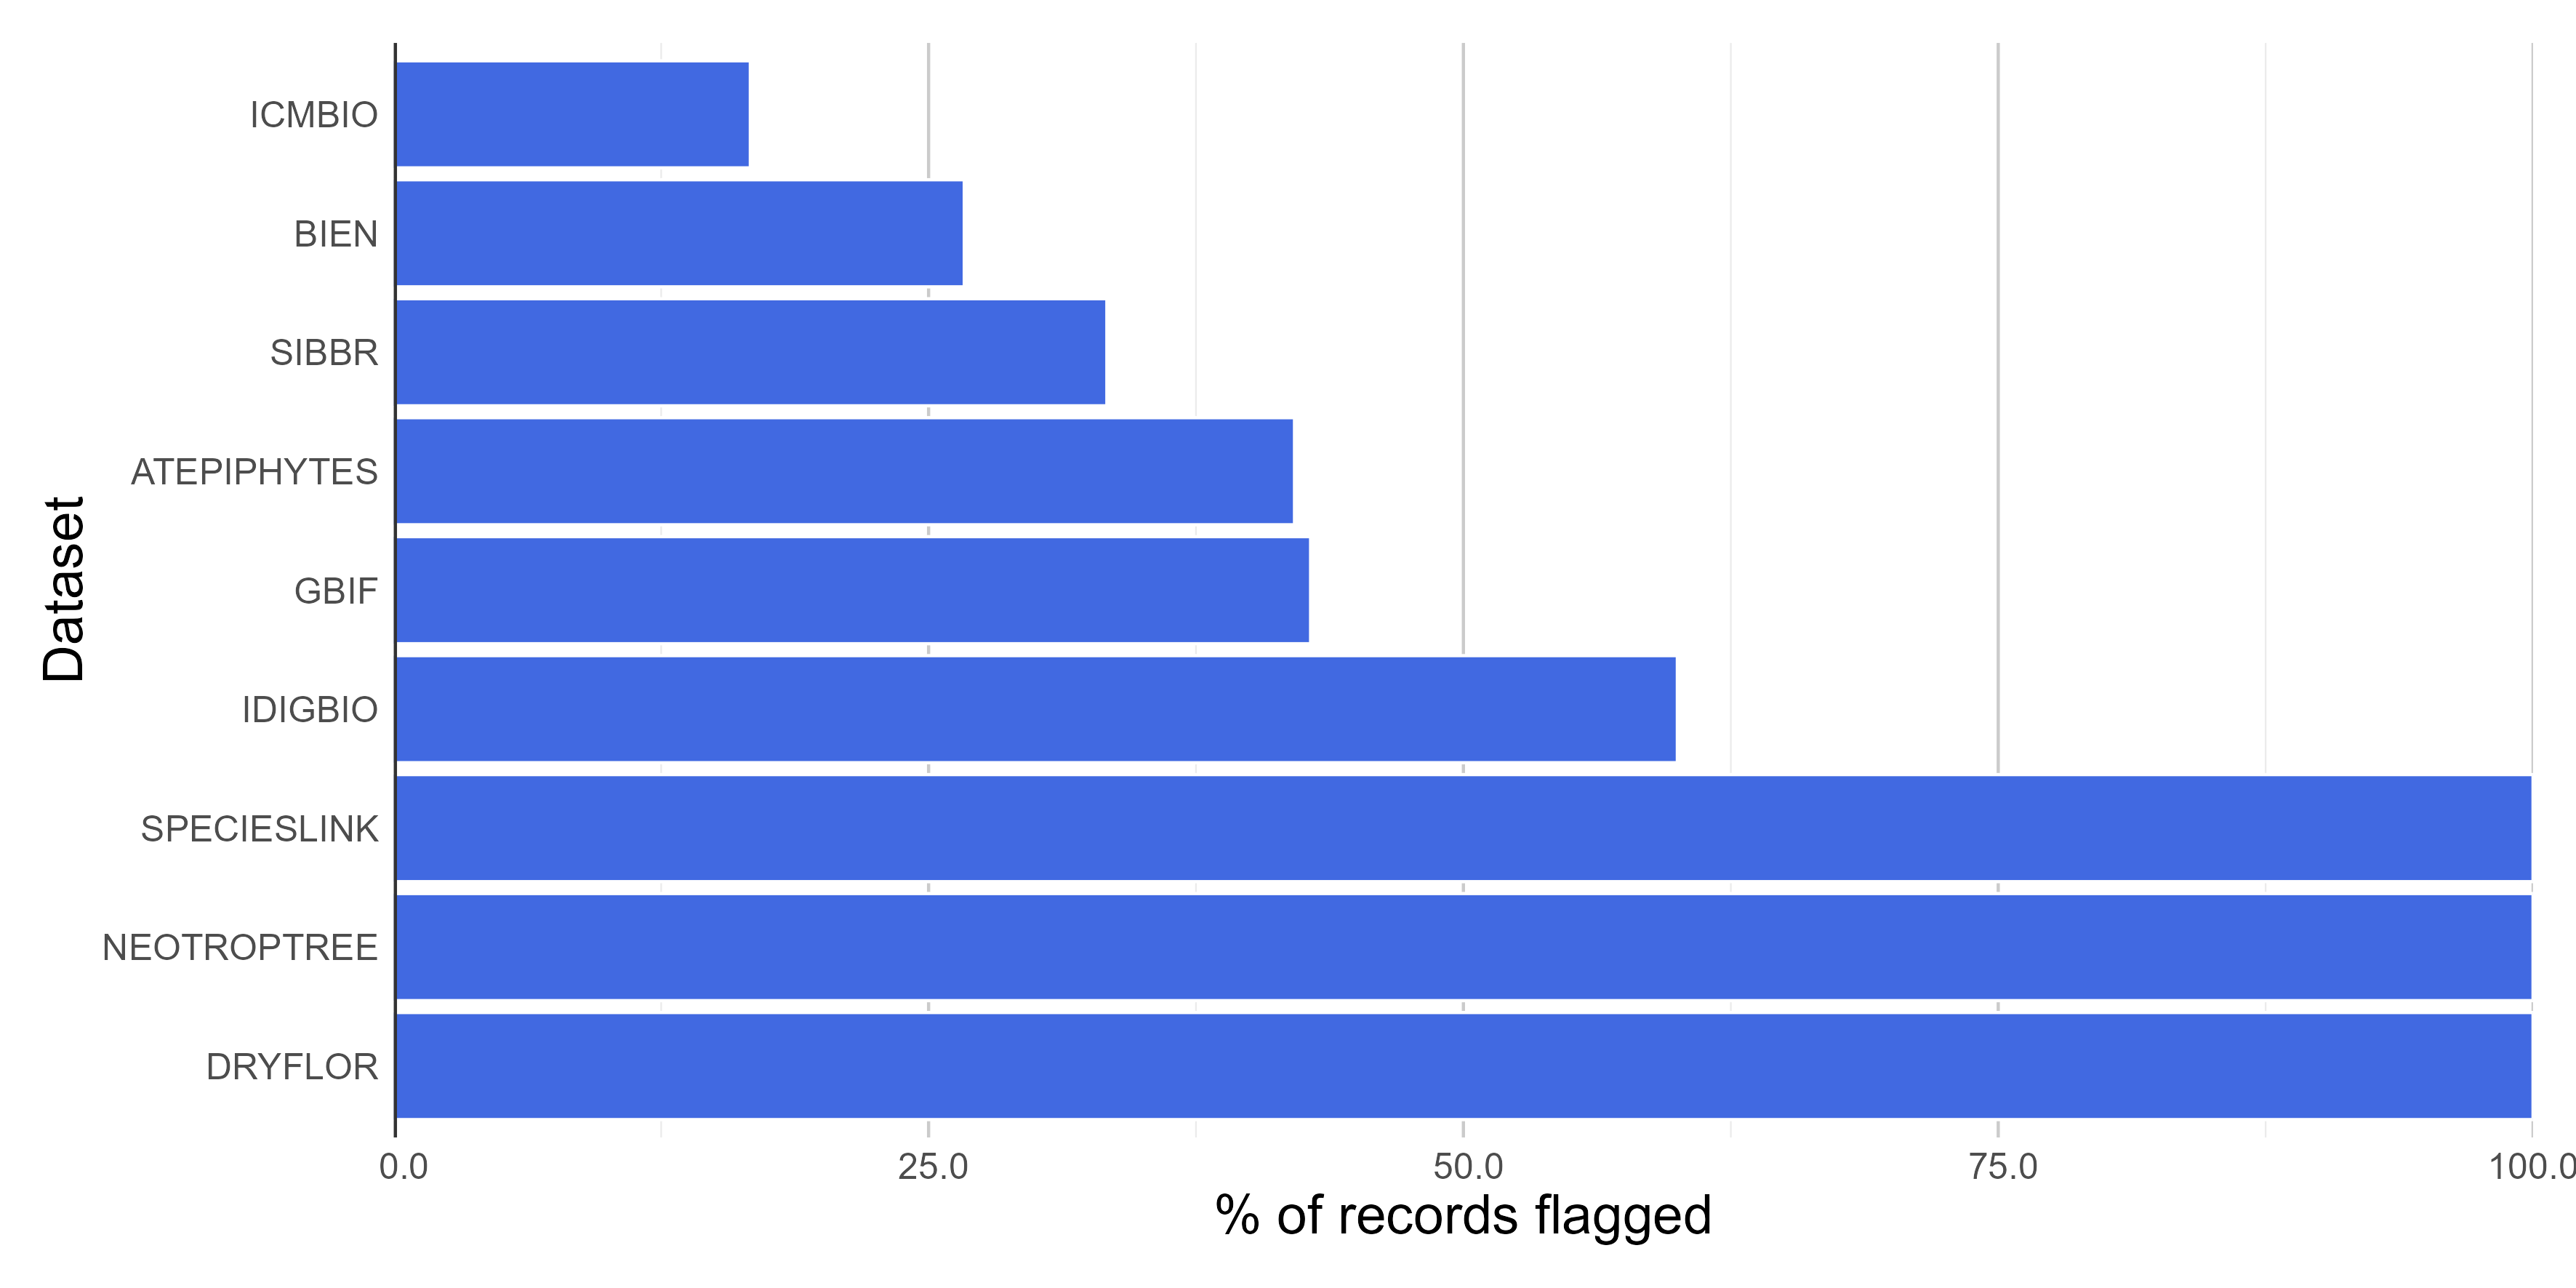
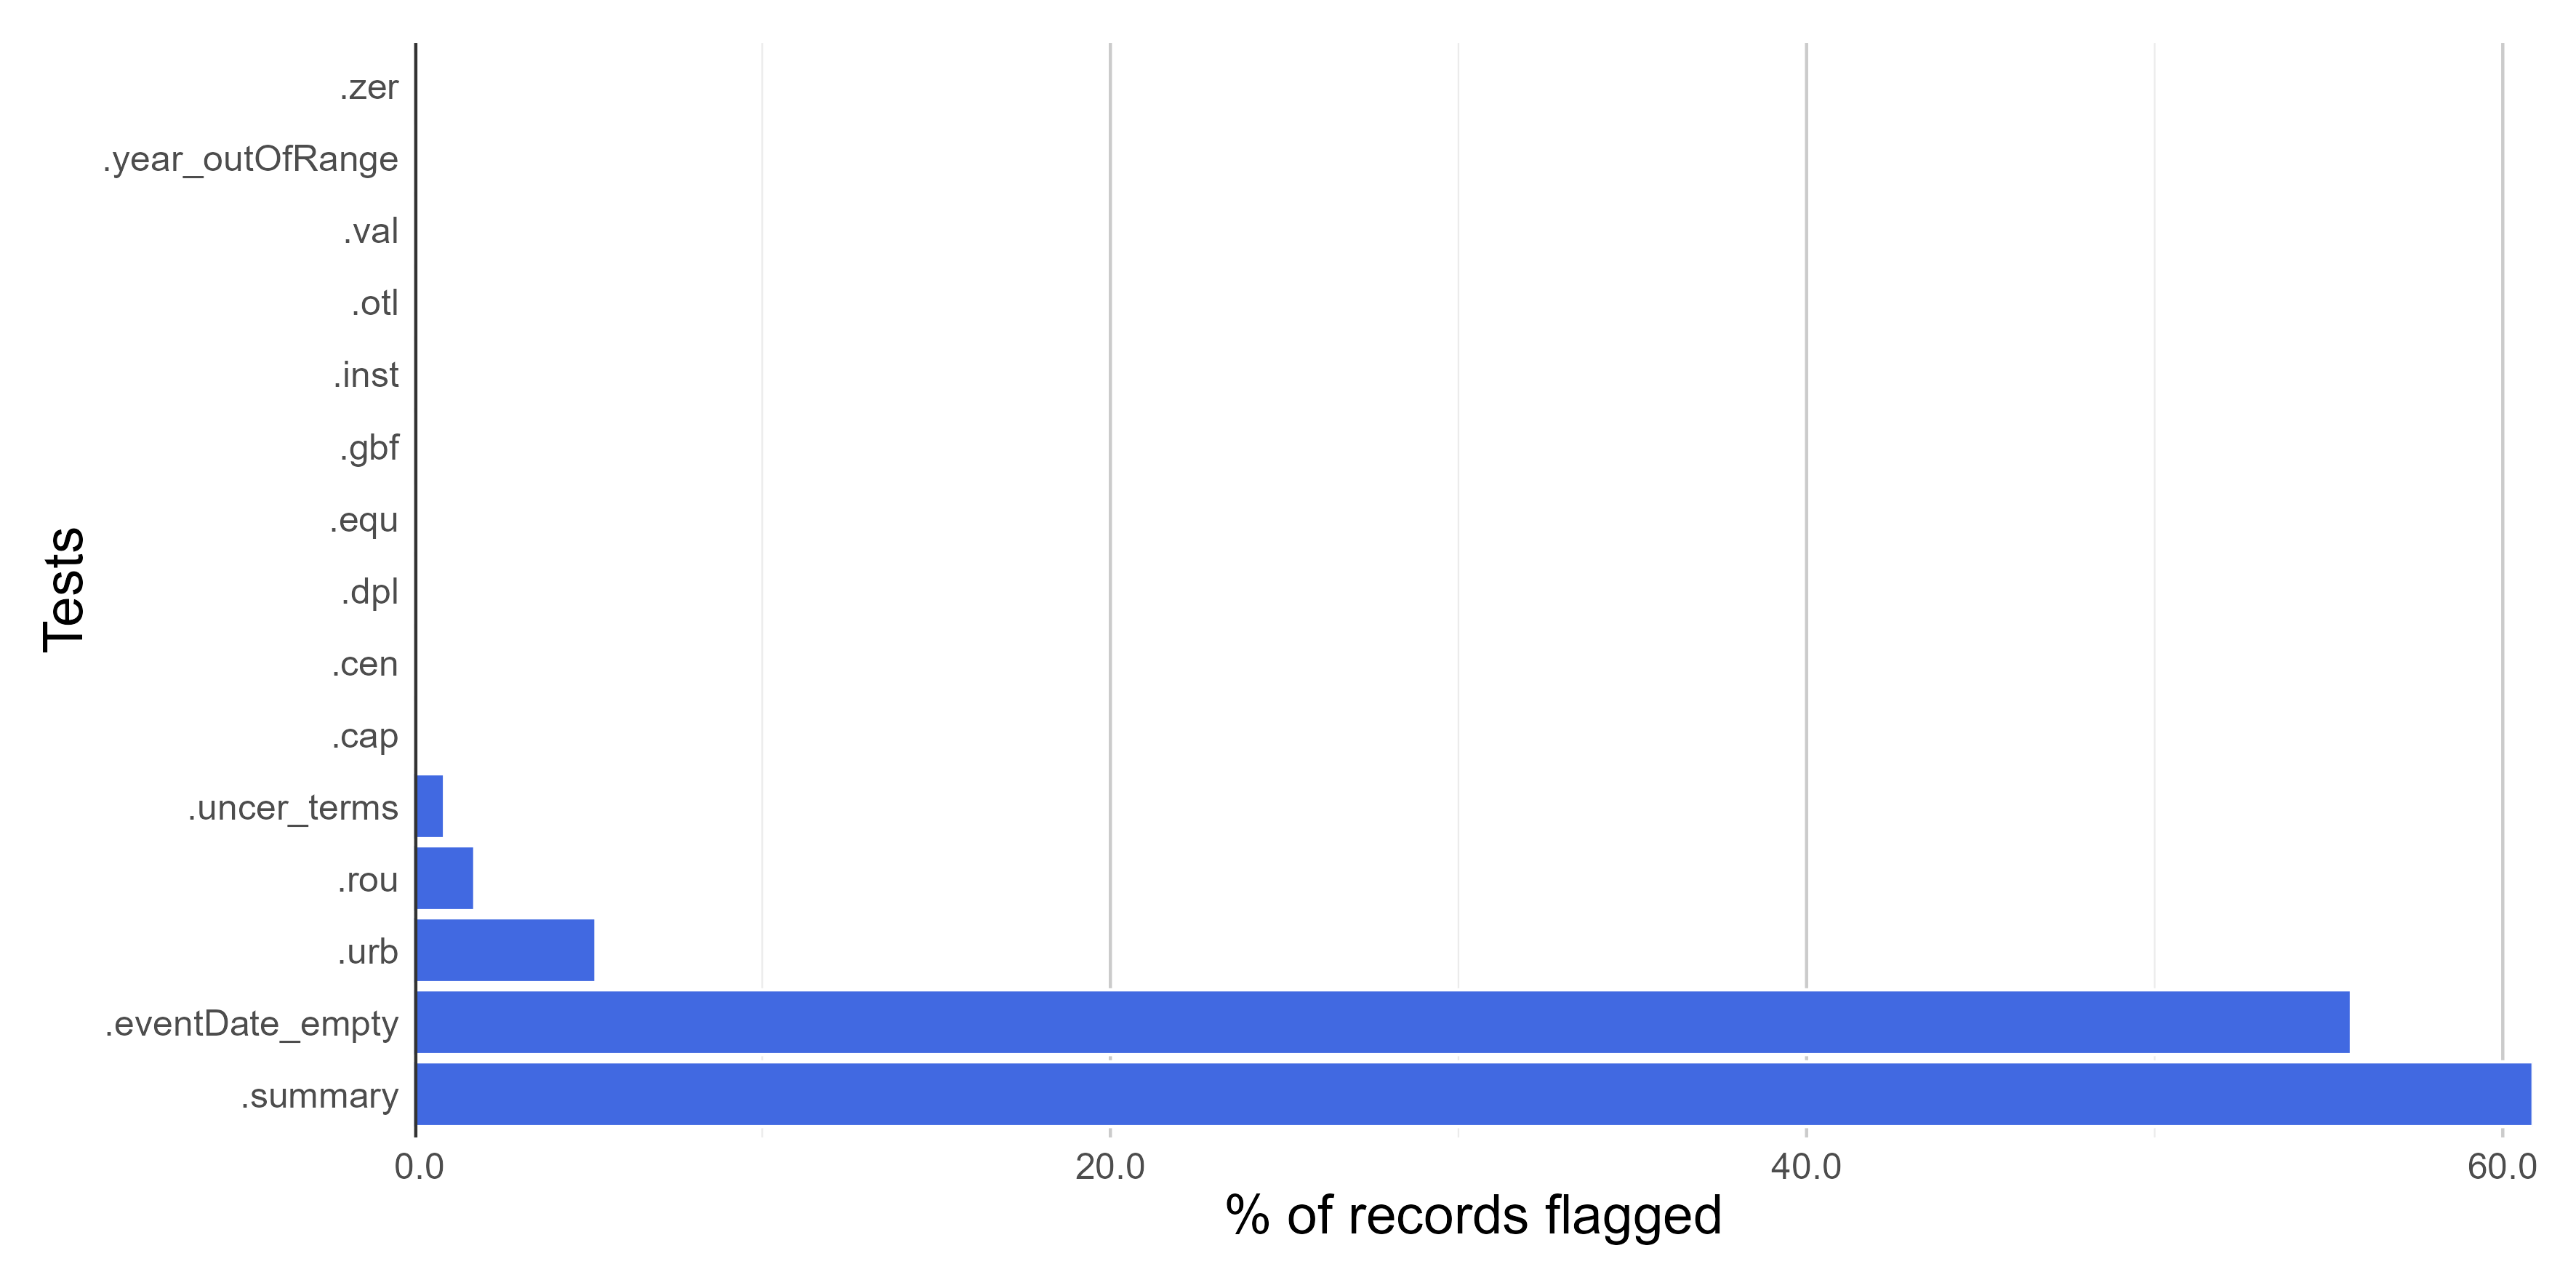
Here we create figures (bar plots and histrogram) to make the interpretation of the results of data quality tests easier. See some examples below. Figures can be automatically saved if `save_figures = TRUE.`
```{r eval=FALSE}
figures <-
bdc_create_figures(data = check_time,
database_id = "database_id",
workflow_step = "time",
save_figures = FALSE)
# Check figures using
figures$time_year_BAR
```


#### **Saving a "raw" database**
Save the original database containing the results of all data quality tests appended in separate columns. You can use [qs::qread()]{.underline} instead of write_csv to save a large database in a compressed format.
```{r eval=FALSE}
check_time %>%
readr::write_csv(.,
here::here("Output", "Intermediate", "04_time_database.csv"))
```
#### **Filtering the database**
Let's remove potentially erroneous or suspect records flagged by the data quality tests applied in all modules of the *bdc* package to get a "clean", "fitness-for-use" database. Note that **25%** (45 out of 180 records) of original records were considered "fitness-for-use" after the data-cleaning process.
```{r}
output <-
check_time %>%
dplyr::filter(.summary == TRUE) %>%
bdc_filter_out_flags(data = ., col_to_remove = "all")
```
#### **Saving a clean "fitness-for-use" database**
You can use [qs::qsave()]{.underline} instead of write_csv to save a large database in a compressed format.
```{r eval=FALSE}
# use qs::qsave() to save the database in a compressed format and then qs:qread() to load the database
output %>%
readr::write_csv(.,
here::here("Output", "Intermediate", "05_cleaned_database.csv"))
```
```{r echo=FALSE, eval=TRUE}
output <-
readr::read_csv(system.file("extdata/outpus_vignettes/05_cleaned_database.csv", package = "bdc"), show_col_types = FALSE)
```
```{r echo=FALSE, message=FALSE, warning=FALSE, eval=TRUE}
DT::datatable(
output[1:15,], class = 'stripe', extensions = 'FixedColumns',
rownames = FALSE,
options = list(
pageLength = 3,
dom = 'Bfrtip',
scrollX = TRUE,
fixedColumns = list(leftColumns = 2)
)
)
```